Category: Visualisation
-
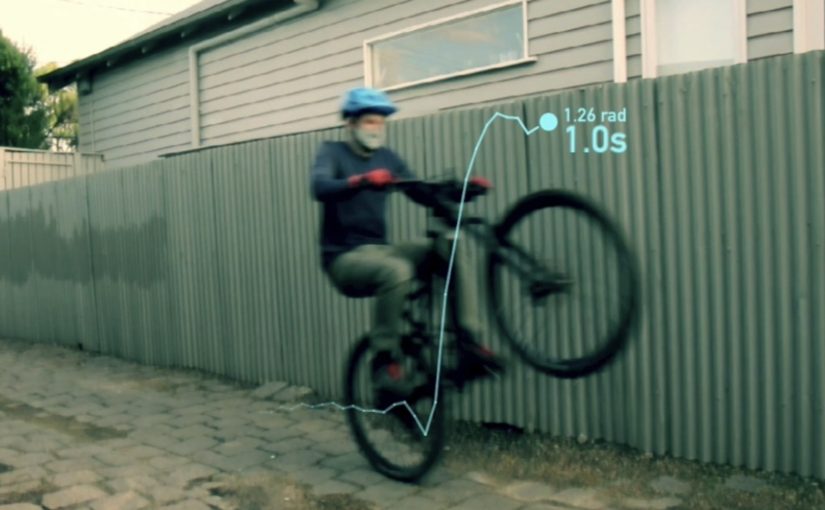
The Lockdown Wheelie Project
“It’s Strava for wheelies,” my lockdown project, combining hyper-local exercise with data analytics to track and guide improvement. Practising wheelies is a great way to stay positive; after all, it’s looking up, moving forward. Read the full write-up over on Medium at The Lockdown Wheelie Project.
-
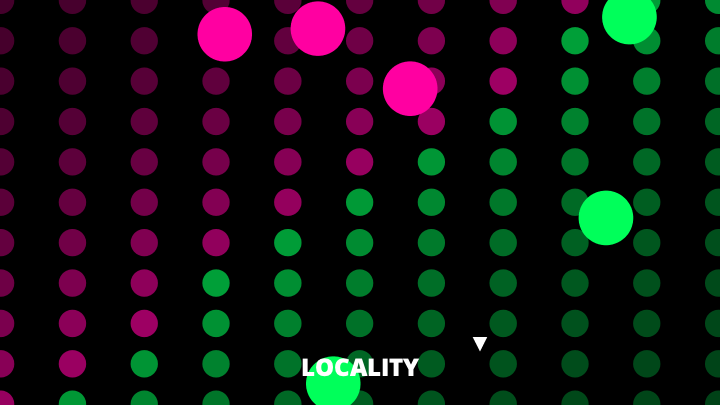
ML Interpretability with Ambient Visualisations
I produced some ambient visualisations as background to short talks on the topic of Interpreting the Opaque Box of ML from ThoughtWorks Technology Radar Volume 21. The talks were presented in at the Thoughtworks booth in breaks at the YOW Developer Conference Melbourne 2019. The visualisations show a binary classification problem with two continuous features.…
-

Curtin HIVE Data Visualisation Presentation (2014)
IT was great fun presenting some novel business data visualisations on the impressive hardware at Curtin Hive. I just found this video from the 2014 presentation – at about 25 minutes, check out “The Matrix” on the 3m x 8m cylindrical display!
-

Scaling Change
Once upon a time, scaling production may have been enough to be competitive. Now, the most competitive organisations scale change to continually improve customer experience. How can we use what we’ve learned scaling production to scale change? I recently presented a talk titled “Scaling Change”. In the talk I explore the connections between scaling production, sustaining…
-

Scaling Change Spoiler
When software engineers think about scaling, they think in terms of the order of complexity, or “Big-O“, of a process or system. Whereas production is O(N) and can be scaled by shifting variable costs to fixed, I contend that change is O(N2) due to the interaction of each new change with all previous changes. We could…
-
The life-changing magic of tidying your work
Surprise! Managing work in a large organisation is a lot like keeping your belongings in check at home. Get it wrong at home and you have mess and clutter. Get it wrong in the organisation and you have excessive work in progress (WIP), retarding responsiveness, pulverising productivity, and eroding engagement. Reading Marie Kondo’s The Life-Changing…
-

Arguments with Agency
Here are slides from my talk at LASTconf 2015. The title is “Bring Your A-Game to Arguments for Change”. The premise is that there are different types of arguments, more or less suited to various organisational and delivery scenarios, and the best ones have their own agency. In these respects, you can think of them like…
-

Fireballs in the Sky wins iAward
Very exciting news for the Fireballs in the Sky app team from Curtin University and ThoughtWorks: the app won the iAwards education category in 2015! The AIIA iAwards are the premier awards program for innovation in the Australian digital economy. Believe me, I am excited, even though Phil gets all the speaking parts in this heavily edited interview 🙂 I…
-

Narrative Visualisation Tools
I use narrative visualisations a lot. I like to frame evidence so that it commands attention, engages playful minds, and tells its own story (see also Corporate Graffiti). I’ll put new tools on GitHub as I create them. Here are three to start. Visualising Stand-Up Attendance I used the Space Invader metaphor with a busy leadership team…
-

Visual Knowledge Cycles
Visualisation is a key tool for the management of knowledge, especially knowledge from data. We’ll explore different states of knowledge, and how we can use visualisation to drive knowledge from one state to another, as individual creators of visualisation and agents within an organisation or society. (There’s some justifiable cynicism about quadrant diagrams with superimposed crap circles. But, give me…