Category: Article
-

No Smooth Path to Good Design
The path to good design is bumpy, as we will demonstrate with four teapots. (Yes, teapots. Teapots are a staple of computer science and philosophy.) The path to good design matters, because if you are trying to build a design capability, the journey will be smoother if you understand that the path is bumpy. Leaders…
-

Concrete Culture Change
Culture is often difficult to define, and culture change even more so – what concrete actions do we need to take to change a culture? Despite this apparent difficulty, it is possible to spend an hour or two with a group, and leave with consensus on practical actions for culture change. This exercise achieves that…
-

Jetty to Jetty app
I released an app 🙂 – for iOS and Android. It’s a self-guided audio tour of historic sites in Broome, Western Australia, including beautiful stories told by locals. Nyamba Buru Yawuru developed the concept, curated the media, engaged local stakeholders, and were product owners for the app. This work was exciting for its value to the…
-

Health Hack Perth 2015
HealthHack is a three-day event bringing medical researchers and health practitioners together with software creators to prototype a new generation of health products. Business News Western Australia covered the Perth 2015 event in: HealthHack – ailments, remedies in equal doses. I helped organise this event with assistance from sponsors ThoughtWorks and Curtin University (among numerous other generous…
-

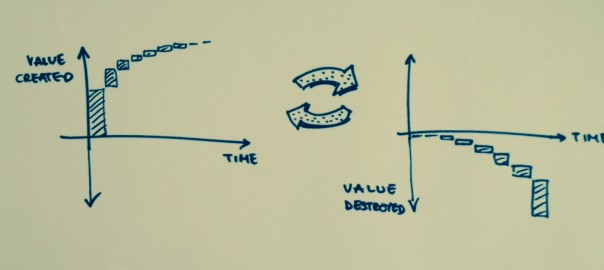
Your Software is a Nightclub
Why a nightclub? Well, it’s a better model than a home loan. I’m talking here about technical debt, the concept that describes how retarding complexity (cost) builds up in software development and other activities, and how to manage this cost. A home loan is misleading because product development cost doesn’t spiral out of control due to missed interest payments over…
-

Visual Knowledge Cycles
Visualisation is a key tool for the management of knowledge, especially knowledge from data. We’ll explore different states of knowledge, and how we can use visualisation to drive knowledge from one state to another, as individual creators of visualisation and agents within an organisation or society. (There’s some justifiable cynicism about quadrant diagrams with superimposed crap circles. But, give me…
-

Iterative vs Incremental Flashcard
Sometimes, the difference between incremental and iterative (software) product development is subtle. Often it is crucial to unlocking early value or quickly eliminating risk – an iterative approach will do this for you, while incremental will not. Let’s review the distinction. Incremental means building something piece by piece, like creating a picture by finishing a jigsaw…
-
The Like-for-Like Project Antipattern
Like-for-like replacement. Sounds pretty simple, doesn’t it? That’s an easy project to deliver, right? Wrong. Why would we do a like-for-like (L4L) project? The IT group may want to upgrade to a new system, because the old one is broken, or because they’ve found something better. Maybe we want to avoid re-training users. Or, maybe…
-
Backwards Prioritisation
Imagine you’re in the middle of a big software project. Maybe, you’re replacing an internal system, or something like that. You make an observation: when asked to prioritise, everyone wants to go last. They want to hang on to the status quo for as long as possible. Instead of beating down your door to get…
-

Augmented/Virtual Reality with Horizontal Coordinates in iOS and Android
So, you want your mobile or tablet to know where in the world you’re pointing it for a virtual reality or augmented reality application? To draw 3D geometry on the screen in OpenGL, you can use the rotation matrixes returned by the respective APIs (iOS/Android). The APIs will also give you roll, pitch and yaw…