
Don’t Repeat Yourself (DRY) is a tenet of software engineering, but – humour me – let’s consider some reasons Why to Repeat Yourself (WRY).
LEGO reuse lessons
In 2021, I wrote a series of posts analysing LEGO® data about parts appearing in sets to understand what it might tell us about reuse of software components in digital products. I’ve finally summarised the key findings that show both DRY and WRY forces at play. We’re strictly talking about reuse VS specialisation (not repetition), but I think the lessons on the reuse dynamic are relevant.
Exponential growth in volume
The total number of LEGO® parts and sets ever created has grown exponentially over the years. The result is that in 2021, there were 10 times as many parts as 30 years ago, and about 5 times as many sets. Thus, even though parts can be re-combined to create new models, new parts are constantly introduced at an increasing rate.

Read more in LEGO as a Metaphor for Software Reuse – Does the Data Stack Up?
Exponential decay in lifespan
While the oldest LEGO® parts are 70 years old, only about 1/7 of all parts ever created are in active use in 2021 and fully 1/3 of parts have a lifespan of only one year. Over time, survival decays exponentially. In each of the first 5 years, 50% of parts don’t survive to the next year. Beyond that, remaining parts halve in number every seven years.

Read more in LEGO and Software – Lifespans.
Power-law distribution of reuse
Some LEGO® parts are heavily reused in sets offered for sale, but the vast majority of parts are never reused or only reused a little, which can be approximated with a power law. Reuse is far more uneven than a typical 80/20 distribution: 80% of reuse instances are due to only 3% of parts, and 20% of parts account for 98% of reuse instances. At the other end of the spectrum, 60% of parts are used in only one set, and only 10% of parts appear in more than 10 sets.
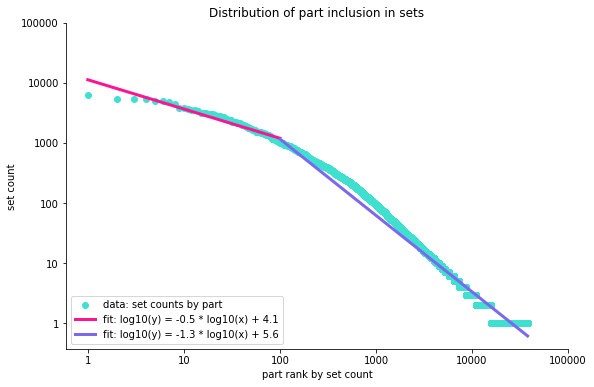
Read more in LEGO and Software – Part Reuse.
Churn driven by growth and specialisation
Given the growth and reuse profiles, total churn of LEGO® parts approached 100% in 2020, whereas in the decade centred on 1990, it was only about 20%. High churn is consistent with a small base of heavily reused parts, and ever-increasing numbers of specialised parts with short lifespans.

Read more in LEGO and Software – Variety and Specialisation and LEGO and Software – Lifespans.
Part roles emerge from the reuse graph
We can understand more about the roles played by specialised and reused LEGO® parts though analysis of the graph of connections between parts and sets, and identify new opportunities for recombination.

Read more in LEGO and Software – Part Roles.
Lessons for software
What would I take away for software?
Reusability of components doesn’t necessarily lead to reuse. The majority of reuse will come from a few components that perform fundamental roles. Focus on getting this right.
More – and more specialised – products may drive specialisation of components. Digital product lines are never static and we may expect some components to have short lifespans and churn heavily. Good development practices and loosely-coupled architectures allow teams to work with ephemeral and idiosyncratic components. However, ongoing review can still identify opportunities to harvest patterns and consolidate specialised components.
Note that, even when we produce multiple similar code artefacts, we may see effective reuse of higher-level approaches and concepts.
These aren’t prescriptive rules, but a reflection of the patterns in the data. There are more comprehensive observations in the individual articles. We should remember that reuse is not the primary aim of producing software, but a principle that supports better organisation towards sustainably responsive delivery.
Discussion of data relevance
Why is LEGO data relevant? In many conversations I’ve had about software reuse, LEGO is presented as a desirable model. This may be peculiar to me, but I think it is a fairly common conversation.
The number of possible mechanical couplings of just a handful of bricks is indeed enormous, but I wanted to understand how these components had actually been assembled into products that were sold to customers over some period of time. The data is sourced from the Rebrickable API. I’ve just taken part data at face value in this analysis; if something is recorded as a distinct part, I treat it as a distinct part. There may be better ways to translate the LEGO metaphor to software components.
Maybe there’s a generational factor in LEGO as a metaphor too; in the 1980s and 1990s, you would play with a much smaller and more stable base of active parts than the 2000s and 2010s, and that could shape your thinking. I’d love to hear feedback.
LEGO® is a trademark of the LEGO Group of companies which does not sponsor, authorize or endorse this site.